The Market Entry of oBike in Munich
While several bike-sharing operators have been active in Munich for some time (Callabike launched in 2000), the concept has recently returned to the spotlight through the new market entrant oBike. Having launched in August 2017, it quickly flooded the streets with its signature yellow bikes. Early in the launch phase, it was unclear just how many bikes were deployed, with low numbers around 350 being communicated and city officials being unsure about further plans (SZ.de)
Due to some earlier analysis on the Callabike network i decided to do some data mining on the bikes and their usage patterns. What follows is an approximate comparison of the three major operators oBike ■ , Callabike ■ and MVG Rad ■ . For this, the official API Endpoints - returning the list of available bikes nearby - were repeatedly crawled. Based on bikes becoming unavailable and then reappearing somewhere else, information on taken trips could be determined. These are approximations, of course, as data glitches or maintenance work does add noise to the data. The MVG Rad data was taken from robbi5.com as they were already crawling the same data in the same intervals.
Bikes and their placement
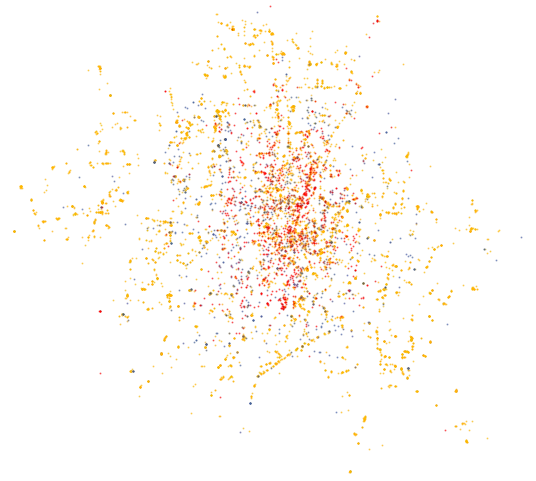
Just by walking around the city, it becomes apparent that the new entrant oBike is following an aggressive strategy with bikes lining almost every street corner. Their sheer number is causing concerns in other cities and now drawing attention by the local government. (SZ.de) Looking at the deployment of bikes over time shows an impressive growth of oBike peaking at 6346 bikes. Unfortunately, the data collection was only started after oBike already had 3500 Bikes in service. Since their peak there has been a slow but steady decline in oBike.
The three operators each have a different definition of their service area, with Callabike limited to the central downtown area, oBike allowing usage within the city limits, and MVG Rad’s coverage somewhere in the middle. Some row patterns are visible in the oBike points, likely from their initial deployment along a road. Having a larger service area does mean less competition in the outer boroughs; however, one would expect the demand to be much lower. Additionally, the larger area complicates service and maintenance.

Movement and Usage Estimation
Calculating movements from the mined data is much more error-prone than estimating the total number of bikes as noise impacts the data quality. However, by applying the same noise reduction techniques on all data sets, a rough relative comparison of the bike-sharing operators should be possible. The duration is recorded in discrete 5min intervals, while distance is the great-circle distance between rental and return location. The speed is based on these distance and duration measures.
As the location data has some noise in it even when the bike is stationary, only trips that are more than 400m and have an average speed of at least 1km/h per hour are taken into account. Any trips with a speed of over 25km/h are disregarded as they likely are drives on relocation/maintenance trucks or noise.
While the trip profile regarding distance and speed is somewhat similar for all operators, oBike, as the new entrant, shows a much lower number of movements per hour, which might be explained by some people trying out the service on shorter test distances.
The total number of movements in a day was divided by the average total number of each operator’s available bikes on that day to get an estimate of network utilization. Here MVG Rad shines with their utilization reaching 200% on some days (an average two trips per bike) with a mean of 121%. The combination of significantly more bikes and lower usage in general shows in the utilization of oBike, reaching a mean utilization of just 4% with a max of 9%
The different strategies regarding service areas are visible in the movement data and mostly as expected. Interestingly the movement patterns of oBike are more similar to Callabike - a high-demand downtown area with some outliers added - than to MVG Rad.
The pattern of MVG Rad might be explained with their optional offering of bike rental stations at subway stations and discounts for subway pass holders. Customers could take the subway and complete the last mile on a rental bike leading to a more spaced driving pattern than more leisure-oriented downtown / Englischer Garten routes.
Looking at the movements over time shows mostly similar behavior for all operators with a small morning peak, large evening peak, and few rides during the night. Open the chart in a new tab to see details.
The initial estimations show that even with generous incentives for new customers (first three rides free; one full free day due to public transport strikes) and a significantly larger number of bikes, it still has a long road ahead. As it is still early in the development, the short observation time frame is not enough to estimate the impact of oBike on the Munich bike-sharing market. However, for now, low utilization rates pose the question of whether the city space is used efficiently.